

Hello. This is Fintag, where you manage your company's bank accounts, cards and loans in one place.
When this month's account balance dips lower than usual, most people shrug it off as "just this month." A large purchase may have landed all at once, or a customer payment may have arrived a few days late. But if the same situation has continued for three months straight, it is a different story. The problem is that looking at a single bank's app makes it hard to tell whether this is a temporary wobble or ongoing pressure.
The report "MyData Shifts the Balance of Power in Finance," published on October 13 by Toss Insight, the financial research institute of Toss, showed exactly this difference in data. The analysis covered individual users, but the principle that risk signals only become visible once scattered financial data is brought together applies just as well to corporate cash management. This post summarizes the report's key figures, the principle behind them, and how a company can read the same signal in numbers.
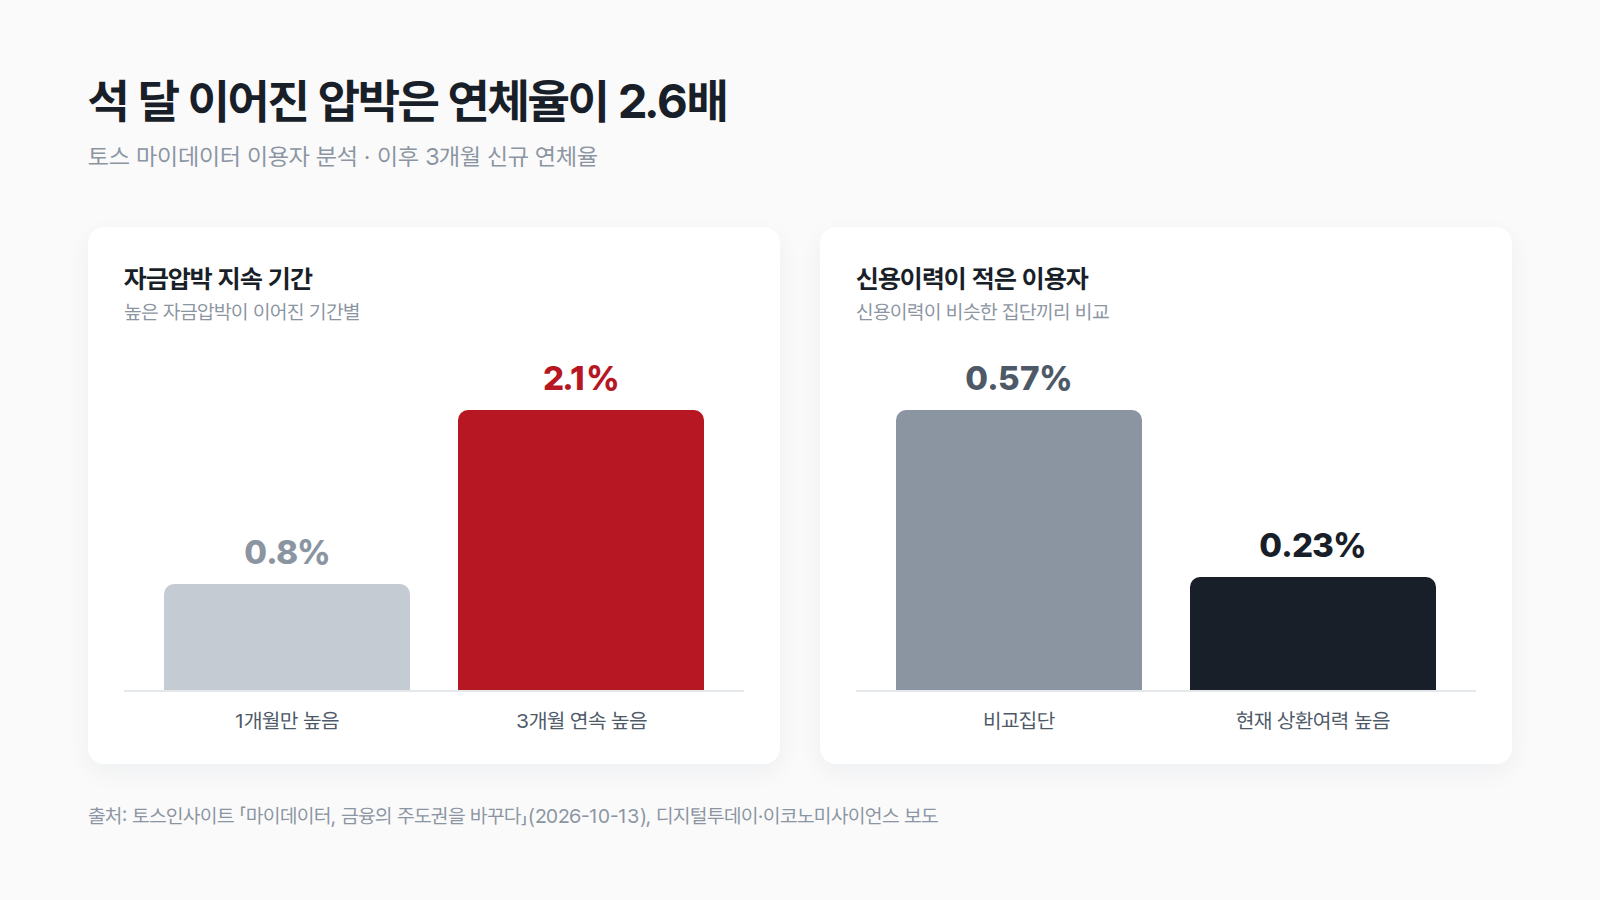
One month versus three months
The most striking finding in the report is the difference in duration. The group that experienced high cash strain for three consecutive months had a new delinquency rate of 2.1% over the following three months, about 2.6 times higher than the 0.8% of the group whose strain was high for only one month. The same "tight on money" condition led to very different outcomes depending on whether it was temporary or lasted the full three months.
There is also a finding in the opposite direction. The group with few credit records but high current repayment capacity had a new delinquency rate of 0.23% over the following three months, less than half the 0.57% of a comparison group with a similar credit history. In other words, having little past history is not the same as having low ability to repay now. On this basis, the researchers argued that "lacking records" and "actually having low repayment capacity" should be assessed separately.
What made both findings possible was the breadth of the data. As of the end of July this year, adult Toss MyData users had connected an average of 16 financial institutions, and actual transactions such as deposits, loans, cards and insurance were confirmed at an average of 10 of them. In cards, for one in four users holding two or more comparable cards, the card offering the greatest benefit changed once spending at other card issuers was analyzed together.
Why scattered data misses the signal
A single bank sees only the deposits and withdrawals in its own accounts. It cannot know whether loans have grown at another bank, whether card payments have increased, or whether the payroll account has changed. So from one institution's records alone, it is hard to judge whether a falling balance comes from a one-off expense or from pressure building in several places at once.
As an analogy, it is the difference between measuring only blood pressure at a checkup and looking at blood pressure, blood sugar and weight together at three-month intervals. A single high blood pressure reading may just reflect how you felt that day, but if several measures have moved in the same direction for three months, that is a clear signal. A signal comes not from a number at a single point in time, but from a pattern of several data points moving together over time.
The same goes for companies. Besides their main bank, most corporations have separate collection accounts, lending banks and corporate card issuers. Each institution's screen may look normal, yet when combined, withdrawals may have outpaced deposits for three months running. This report dealt with personal data, but the principle that ongoing pressure only becomes visible when scattered information is gathered into one unit applies equally to company cash.
Where the signal shows up in company data
So where should you look in a company's financial data? Pressure usually appears not in one place but a little at a time in several places at once. The following four items are hard to spot when you check each bank's screen separately, but often move in the same direction once brought together.
- Collection intervals — Whether payment dates from key customers are starting to slip by a week or two. If sales stay the same but cash arrives later, the balance falls first.
- Card payments — Whether corporate card bills grow every month. When cash is tight and spending is pushed onto cards, it all comes back at once on the next payment date.
- Overdraft and credit line usage — Whether the amount drawn on a credit line grows at the same time each month and rolls over to the next month without being fully repaid.
- Share of fixed spending — Whether hard-to-cut expenses such as payroll, rent and loan repayments take up a growing share of total outflows.
Looked at one by one, each item may seem to have its own explanation, but if they are all worsening over the same three months, it is unlikely to be a temporary wobble. You can only see this simultaneous movement when data from multiple institutions is aligned to the same date.
Three metrics that turn the signal into numbers
To see the degree of pressure on company cash as a single number, it is practical to start with these three metrics.
- Available cash — The sum of cash balances in all accounts right now. Combine them into one number instead of checking each bank separately.
- Burn rate — The average amount of money going out per month. Calculate it by dividing the total outflows over the last three months by three. A single month can be swayed by one large expense, so a three-month average is used.
- Runway — The number of months you could last on current cash, assuming no new money comes in. It is available cash divided by burn rate.
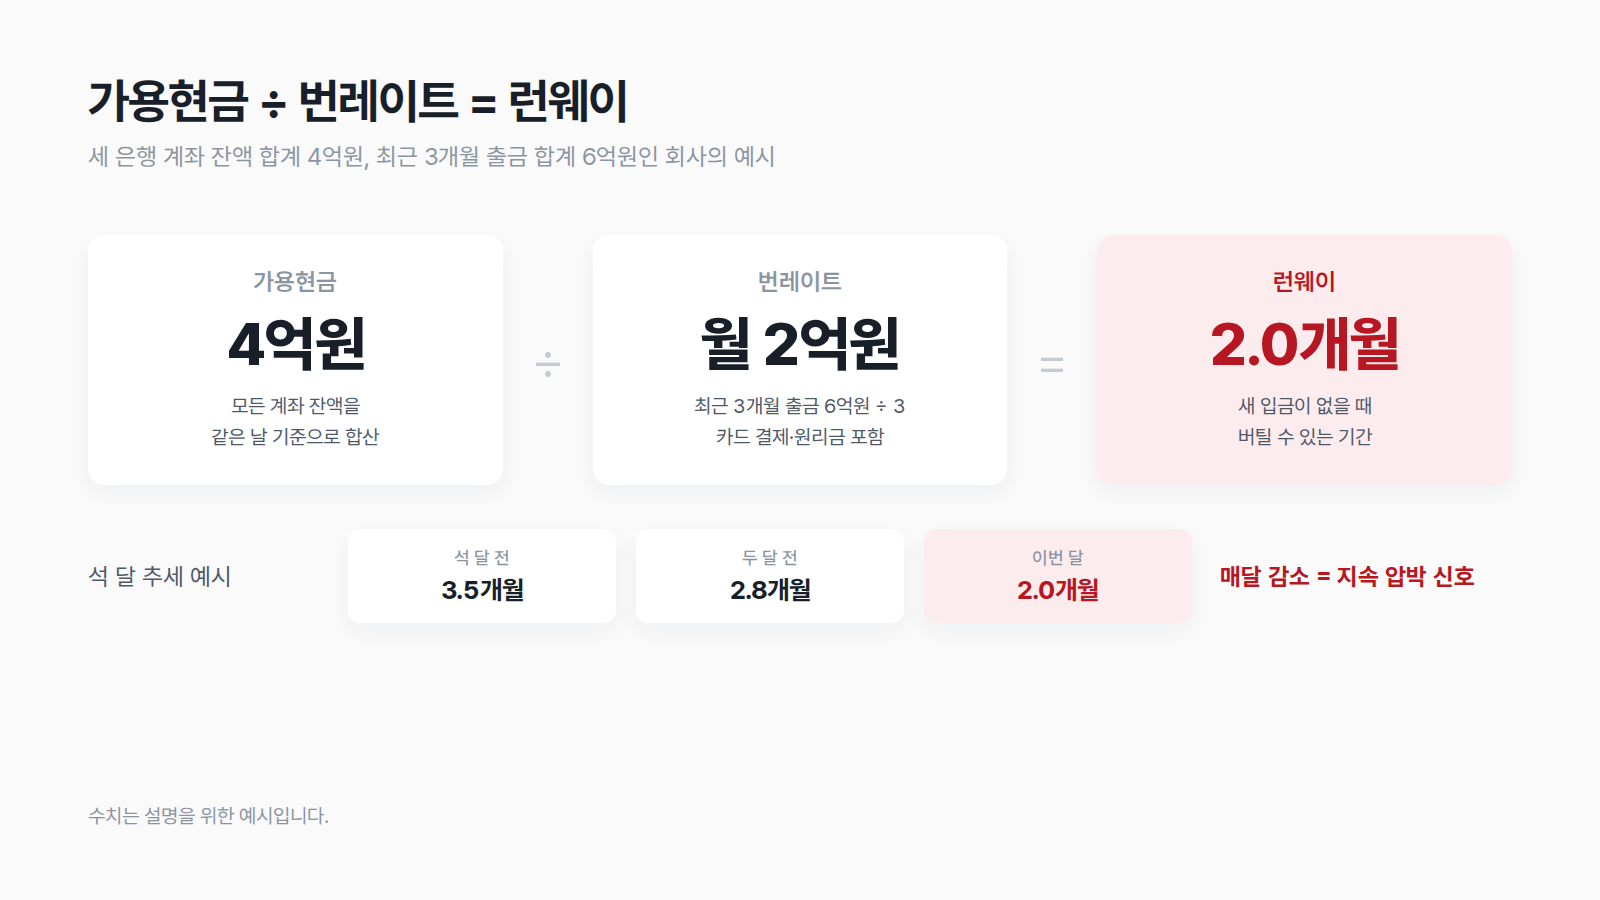
For example, if available cash across three bank accounts totals 400 million won and outflows over the last three months total 600 million won, the burn rate is 200 million won per month and the runway is 2.0 months. If the same company's runway was 3.5 months three months ago, 2.8 months two months ago and 2.0 months this month, shrinking every month, that should be seen as ongoing pressure rather than a one-month wobble. Conversely, if only this month is at 2.0 months and the previous two months were in the 3-month range, a large one-off expense is the more likely explanation.
What this judgment needs is not a complex model but the habit of recording the same, all-accounts-combined number on the same day every month. If you check each bank separately, the totals drift from date to date, and you cannot read the trend.
Forecasts need to be scored too
If metrics show the past, a cash flow forecast shows what your balance will look like a few weeks ahead. But forecasts are bound to be wrong, and what matters is knowing by how much, and in which direction, they miss. If a model always predicts a higher balance than reality, planning spending on that optimism can get you into trouble.
Fintag's cash flow forecast handles this problem through scoring. It compares past forecasts against actual balances date by date and records how far forecasts 1, 7 and 30 days ahead each missed. It then takes the median bias for each horizon (how much forecasts came out higher or lower than actual) from recent scoring history and corrects the next forecast by that amount. Horizons with fewer than five scored samples are not corrected. This prevents overfitting, where the forecast gets skewed to match a few chance errors.
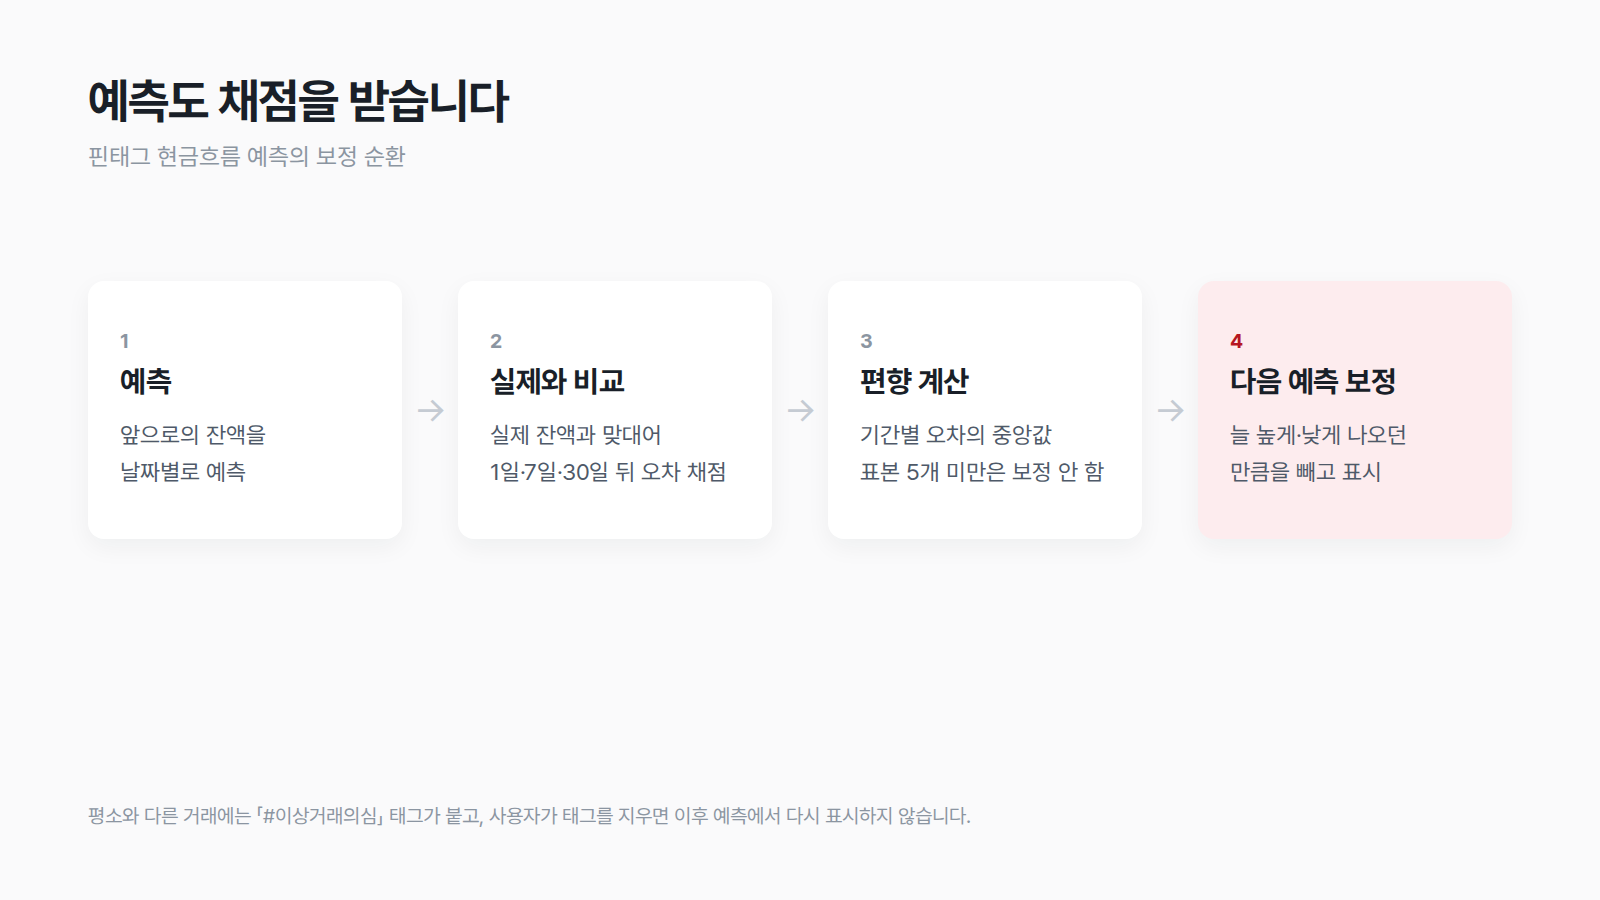
Flagging unusual transactions separately follows the same logic. Transactions that look like anomalous patterns during forecasting get a 「#SuspectedAnomaly」 tag, and if the user judges a transaction to be normal and removes the tag, later forecasts will not flag that transaction as anomalous again. Human judgment feeds into the next forecast.

A checklist to try today
Reading signals by gathering data is simpler to start than you might think.
- List your accounts — Write every bank account, loan and corporate card in the company's name on a single list. Do not leave out rarely used accounts.
- Combine balances on the same day — Pick one date, such as the last day of each month, and record available cash as the sum of all account balances.
- Calculate a three-month burn rate — Divide total outflows over the last three months by three. Include card payments and loan principal and interest repayments in outflows.
- Look at the runway trend — Put three months of runway (available cash divided by burn rate) side by side and check whether it is shrinking each month.
- Mark the driving transactions — Find the transactions that moved runway the most, and note whether each is one-off or recurring.
| Runway trend | Interpretation | Next step |
|---|---|---|
| Drop in one month only | Possibly a large one-off expense | Check the driving transaction, then watch |
| Drop three months in a row | Signal of ongoing cash strain | Adjust spending schedule, check credit lines in advance |
| Drop then recovery | Often a delayed payment that cleared | Record which customers paid late |
The 2.6x difference the report revealed ultimately came down to "whether three months were viewed on the same basis." For company cash, too, instead of being alarmed or reassured by a single month's number, start by reading the all-accounts-combined number in three-month units.
📌 Bring your scattered accounts together and check the three-month trend first. Once you register a digital certificate or financial institution account, Fintag automatically updates accounts, cards and loans across multiple banks and card issuers on a regular basis, and shows available cash, runway and cash flow forecasts on one screen. See your company's cash flow for yourself with a 2-week free trial. → app.fintag.kr
Thank you. From Fintag.